

Project Orion
Project Overview
UI/UX, Product Design
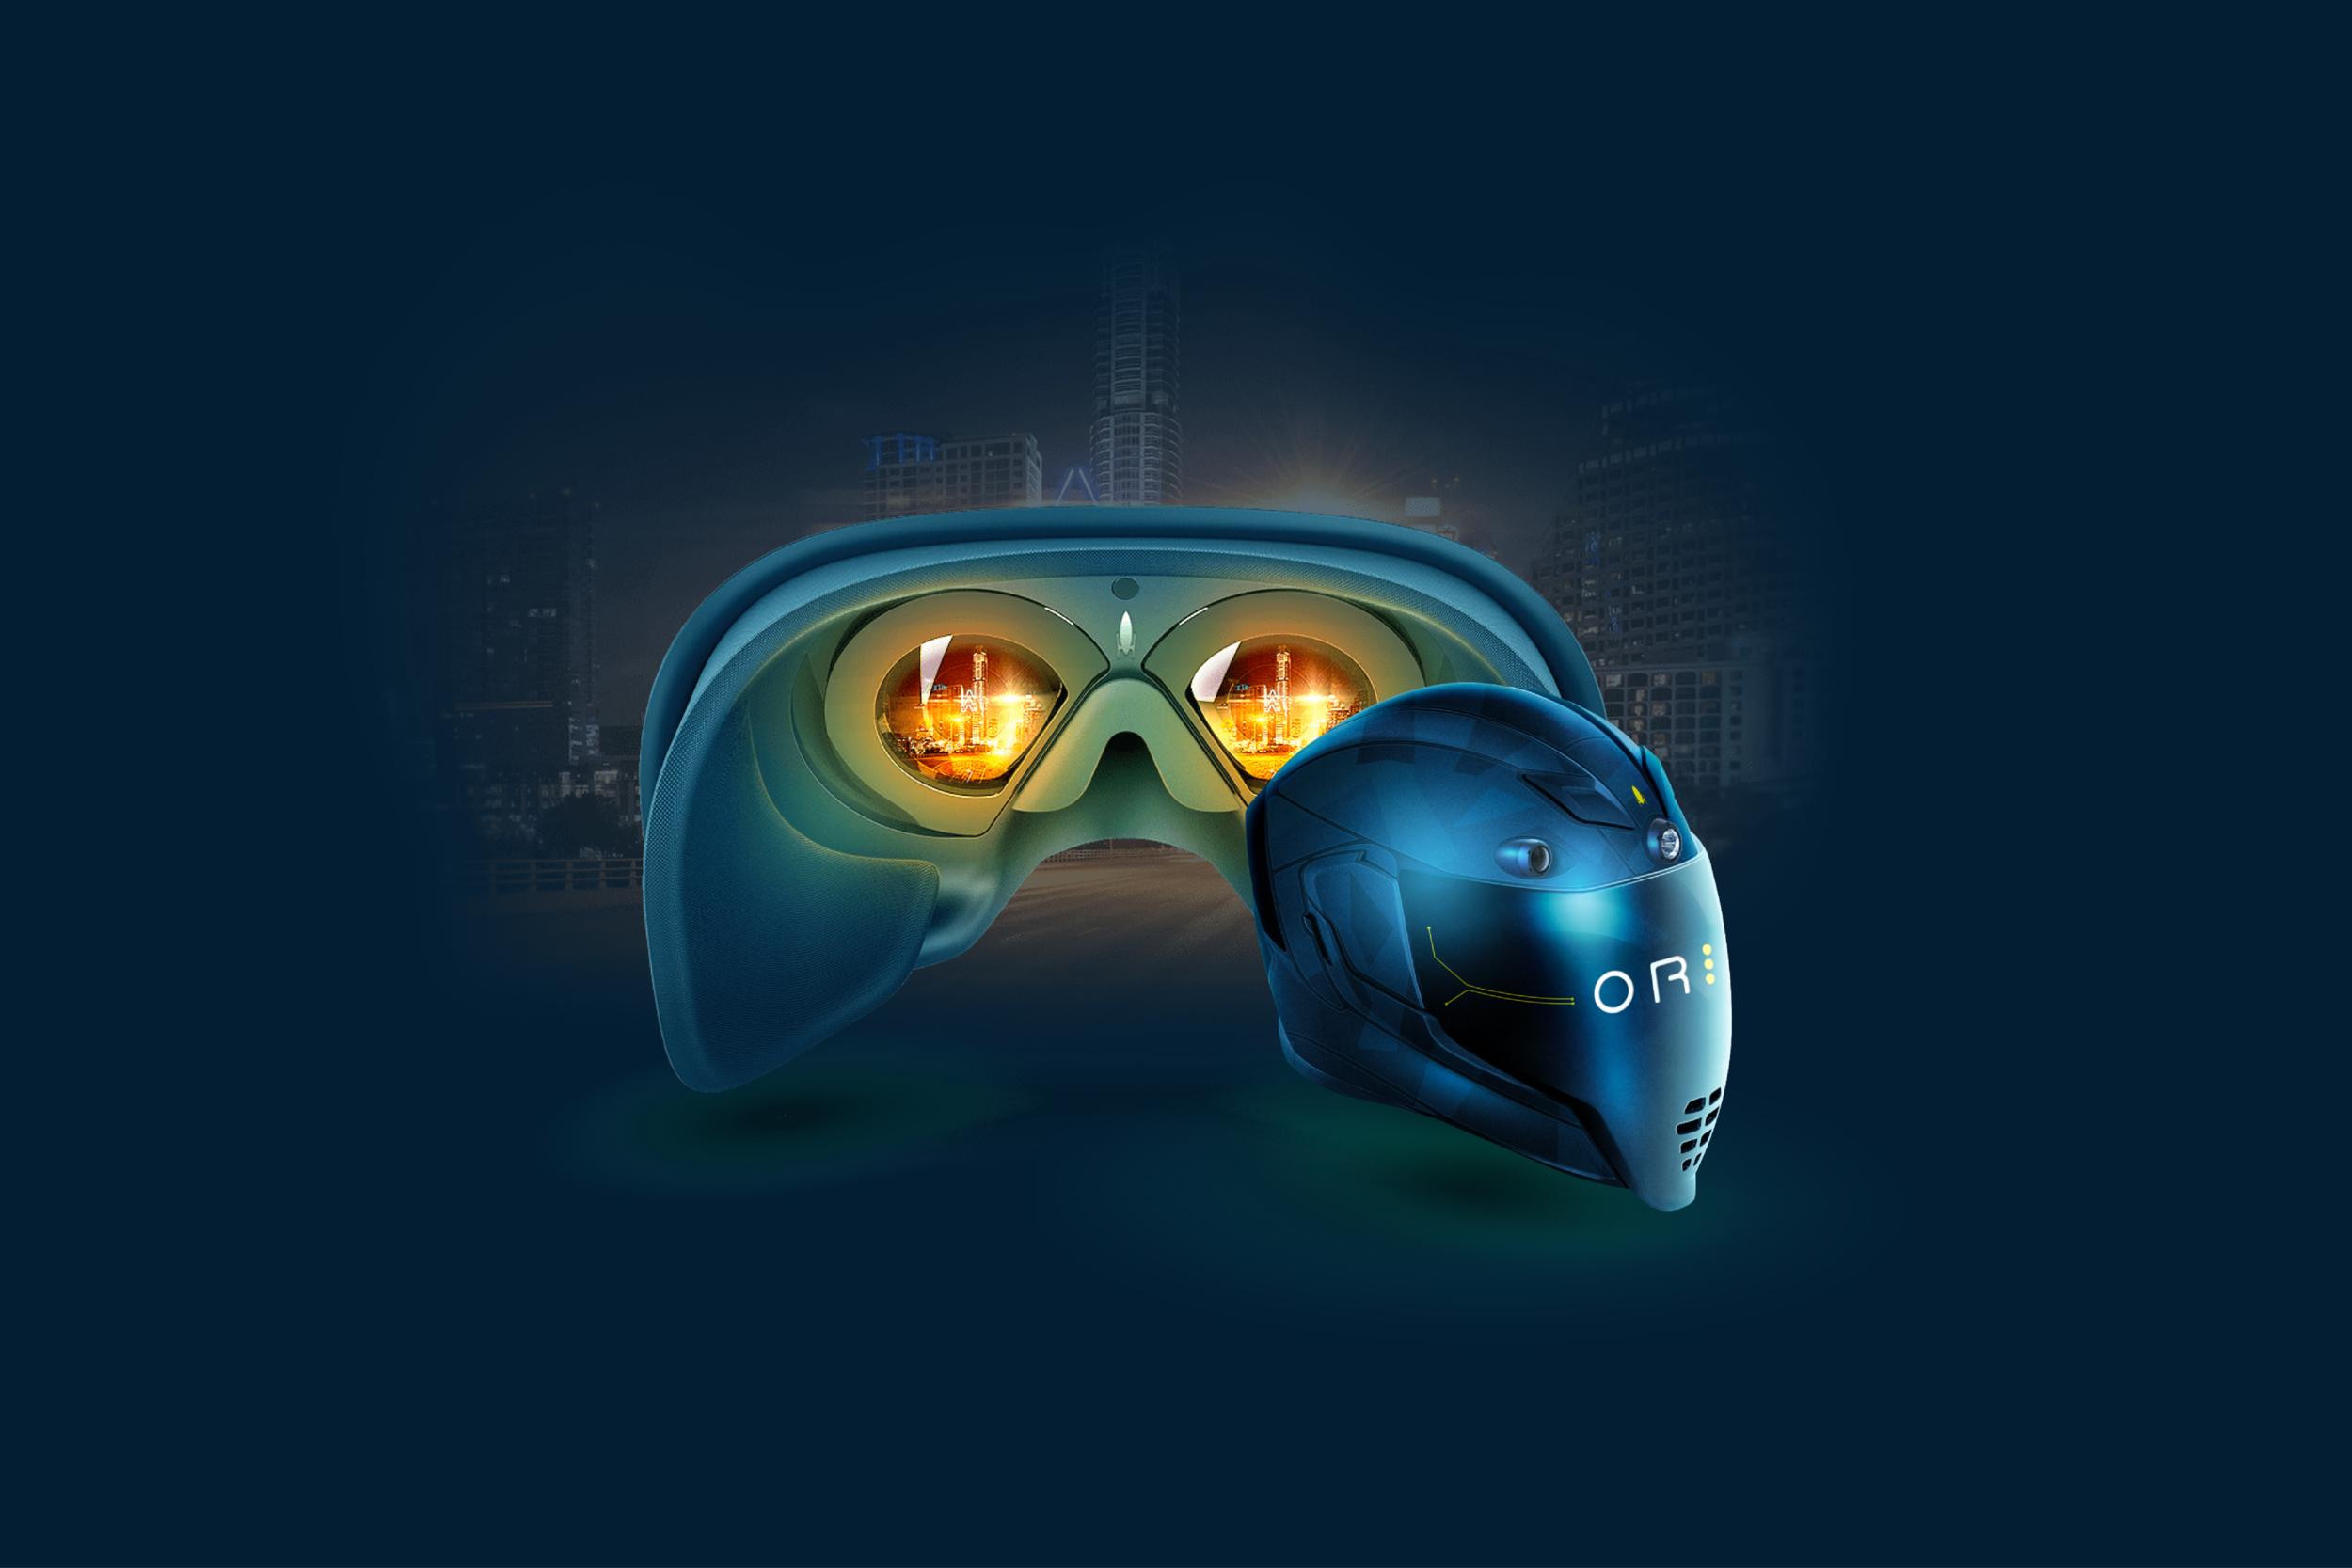
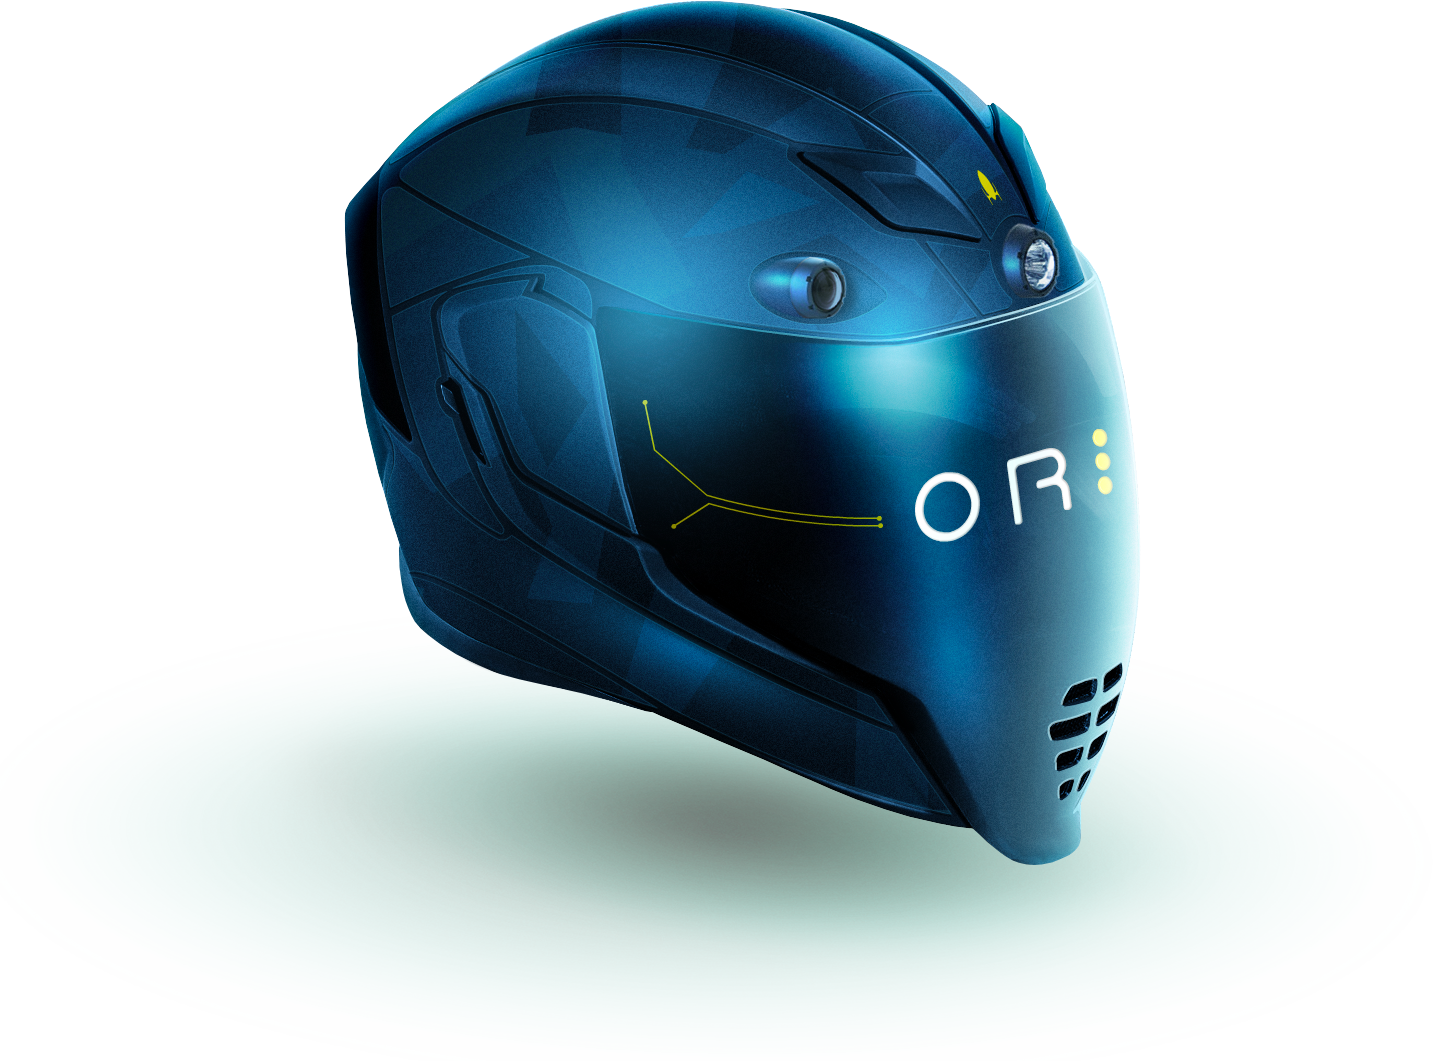
Project Orion is a new Augmented Reality Active Display helmet prototype with a wide array of built-in sensors to augment and extend human capability for increased situational awareness. In addition to night-vision, infrared, thermal imaging, and more, Project Orion delivers an intuitive, interactive head-up display (HUD) that provides users with previously unimaginable field-technology assets.
Intent
Develop a tool aimed at enhancing the navigation capabilities of users with the Hypergiant R&D team. In challenging and diverse terrains, professionals often encounter situations where their visibility may be compromised. This tool is designed to enhance their situational awareness and create a safer navigation experience for them during operations.
My Roles
UI/UX Design
Visual Design
Prototyping & Testing
Background
In collaboration with Hypergiant’s Design and R&D team, we developed Project Orion, and VR display kit that is aimed at enhancing users' situational awareness
Here are some of my responsibilities for this project listed below:
Initiated a design process. Hosted regular updates between teams and facilitated our teams to implement a more structured approach to our work while providing other teams with visibility into our upcoming designs and execution plans.
Conducted usability Testings. I conducted user testing using eye tracking to observe behaviors and assess how quickly users understood displayed data. Specific metrics like task completion rates, time on task, and eye fixation patterns, were used to provide actionable insights aligned with established design practices.
Created design artifacts. Though I designed new assets for this project, I was able to implement existing components in the asset library, ensuring a cohesive experience across platforms and reducing development costs.
Delivery Process
In my role as a UI/UX designer, I revamped the project delivery process to enhance clarity on project objectives and goals across various teams. This involved collaborating with teams such as strategy, design, AI, and development to ensure a streamlined and efficient product delivery process.

Research
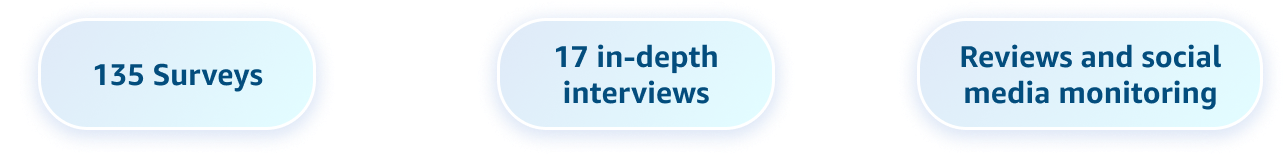
We conducted 135 online surveys and 17 user interviews to gather user insights regarding the types of VR products currently in use and to understand their preferences for interacting with these tools. The surveys aimed to delve into users' experiences, expectations, and specific requirements concerning VR usage and interaction methods.
The survey revealed a noteworthy finding: over 75% of users are open to the utilization and measurement of their biometric data if the benefits surpass the security apprehensions. Moreover, if a simple disclaimer clarifying how their data is used can address security concerns, users are more inclined to accept such measures.
This insight underscores the importance of transparent communication and emphasizes the benefits to users when implementing biometric data usage in tools and systems.


Wireframing
In my wireframe designs, I placed a strong emphasis on accurately representing the Field of View (FOV) within the VR display helmet, taking into account its limitations and capabilities in depicting the virtual environment. This involved identifying and delineating interactive zones for user engagement with virtual elements like buttons, menus, and interactive objects. These zones were crafted to ensure accessibility and intuitiveness, aiming for a smooth and user-friendly interaction experience.

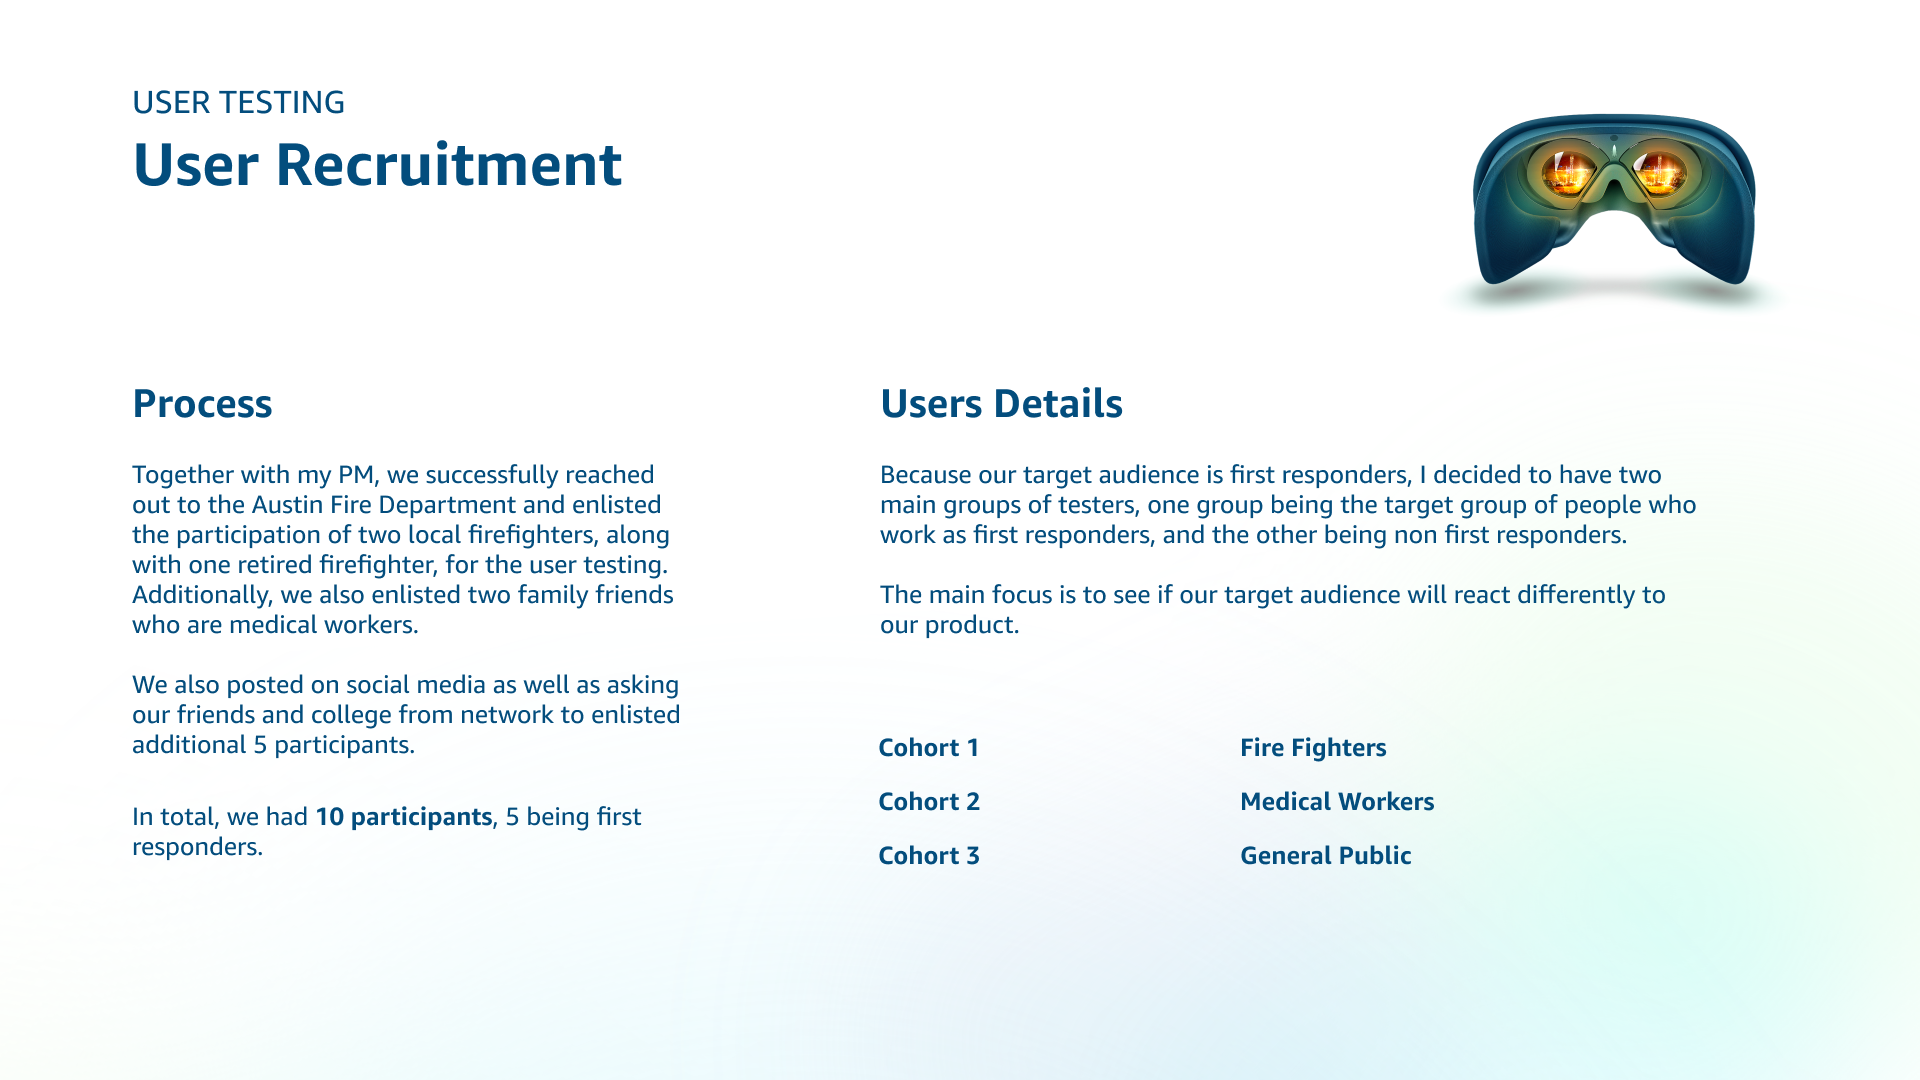
User Testing


Challenges
Challenge 1
Field of View: I conducted user testing in realistic scenarios to gather feedback on usability, effectiveness, and user comfort, which can be logistically complex in VR environments. Due to the helmet's curved design, the visuals need to adapt to the curves and distortions. Some users reported that they had trouble concentrating as well as experiencing difficulty seeing the visuals towards the edge.

A/B Tested Features
HUD Display
HUD outline variations were tested among selected users to compare visibility and usability. The last thermal mask with the most curves showed a 15% improvement in visibility based on user testing groups.

Crosshair
The inclusion of a central crosshair enhanced user engagement, with 100% of the users reporting a preference for the display featuring a central point and clear indicator pointers.
Challenge 2
Information Layout: To develop intuitive and ergonomic interaction methods for the VR interface, I examined four other popular VR products on the market. I compared how their interfaces adapt to meet user needs in both complex and simple environments.


During user testing, many participants expressed confusion about where to focus their attention. Several were observed scanning from left to right, unsure of what actions to take. The excessive concentration of information around the frame led to erratic vertical scanning patterns.
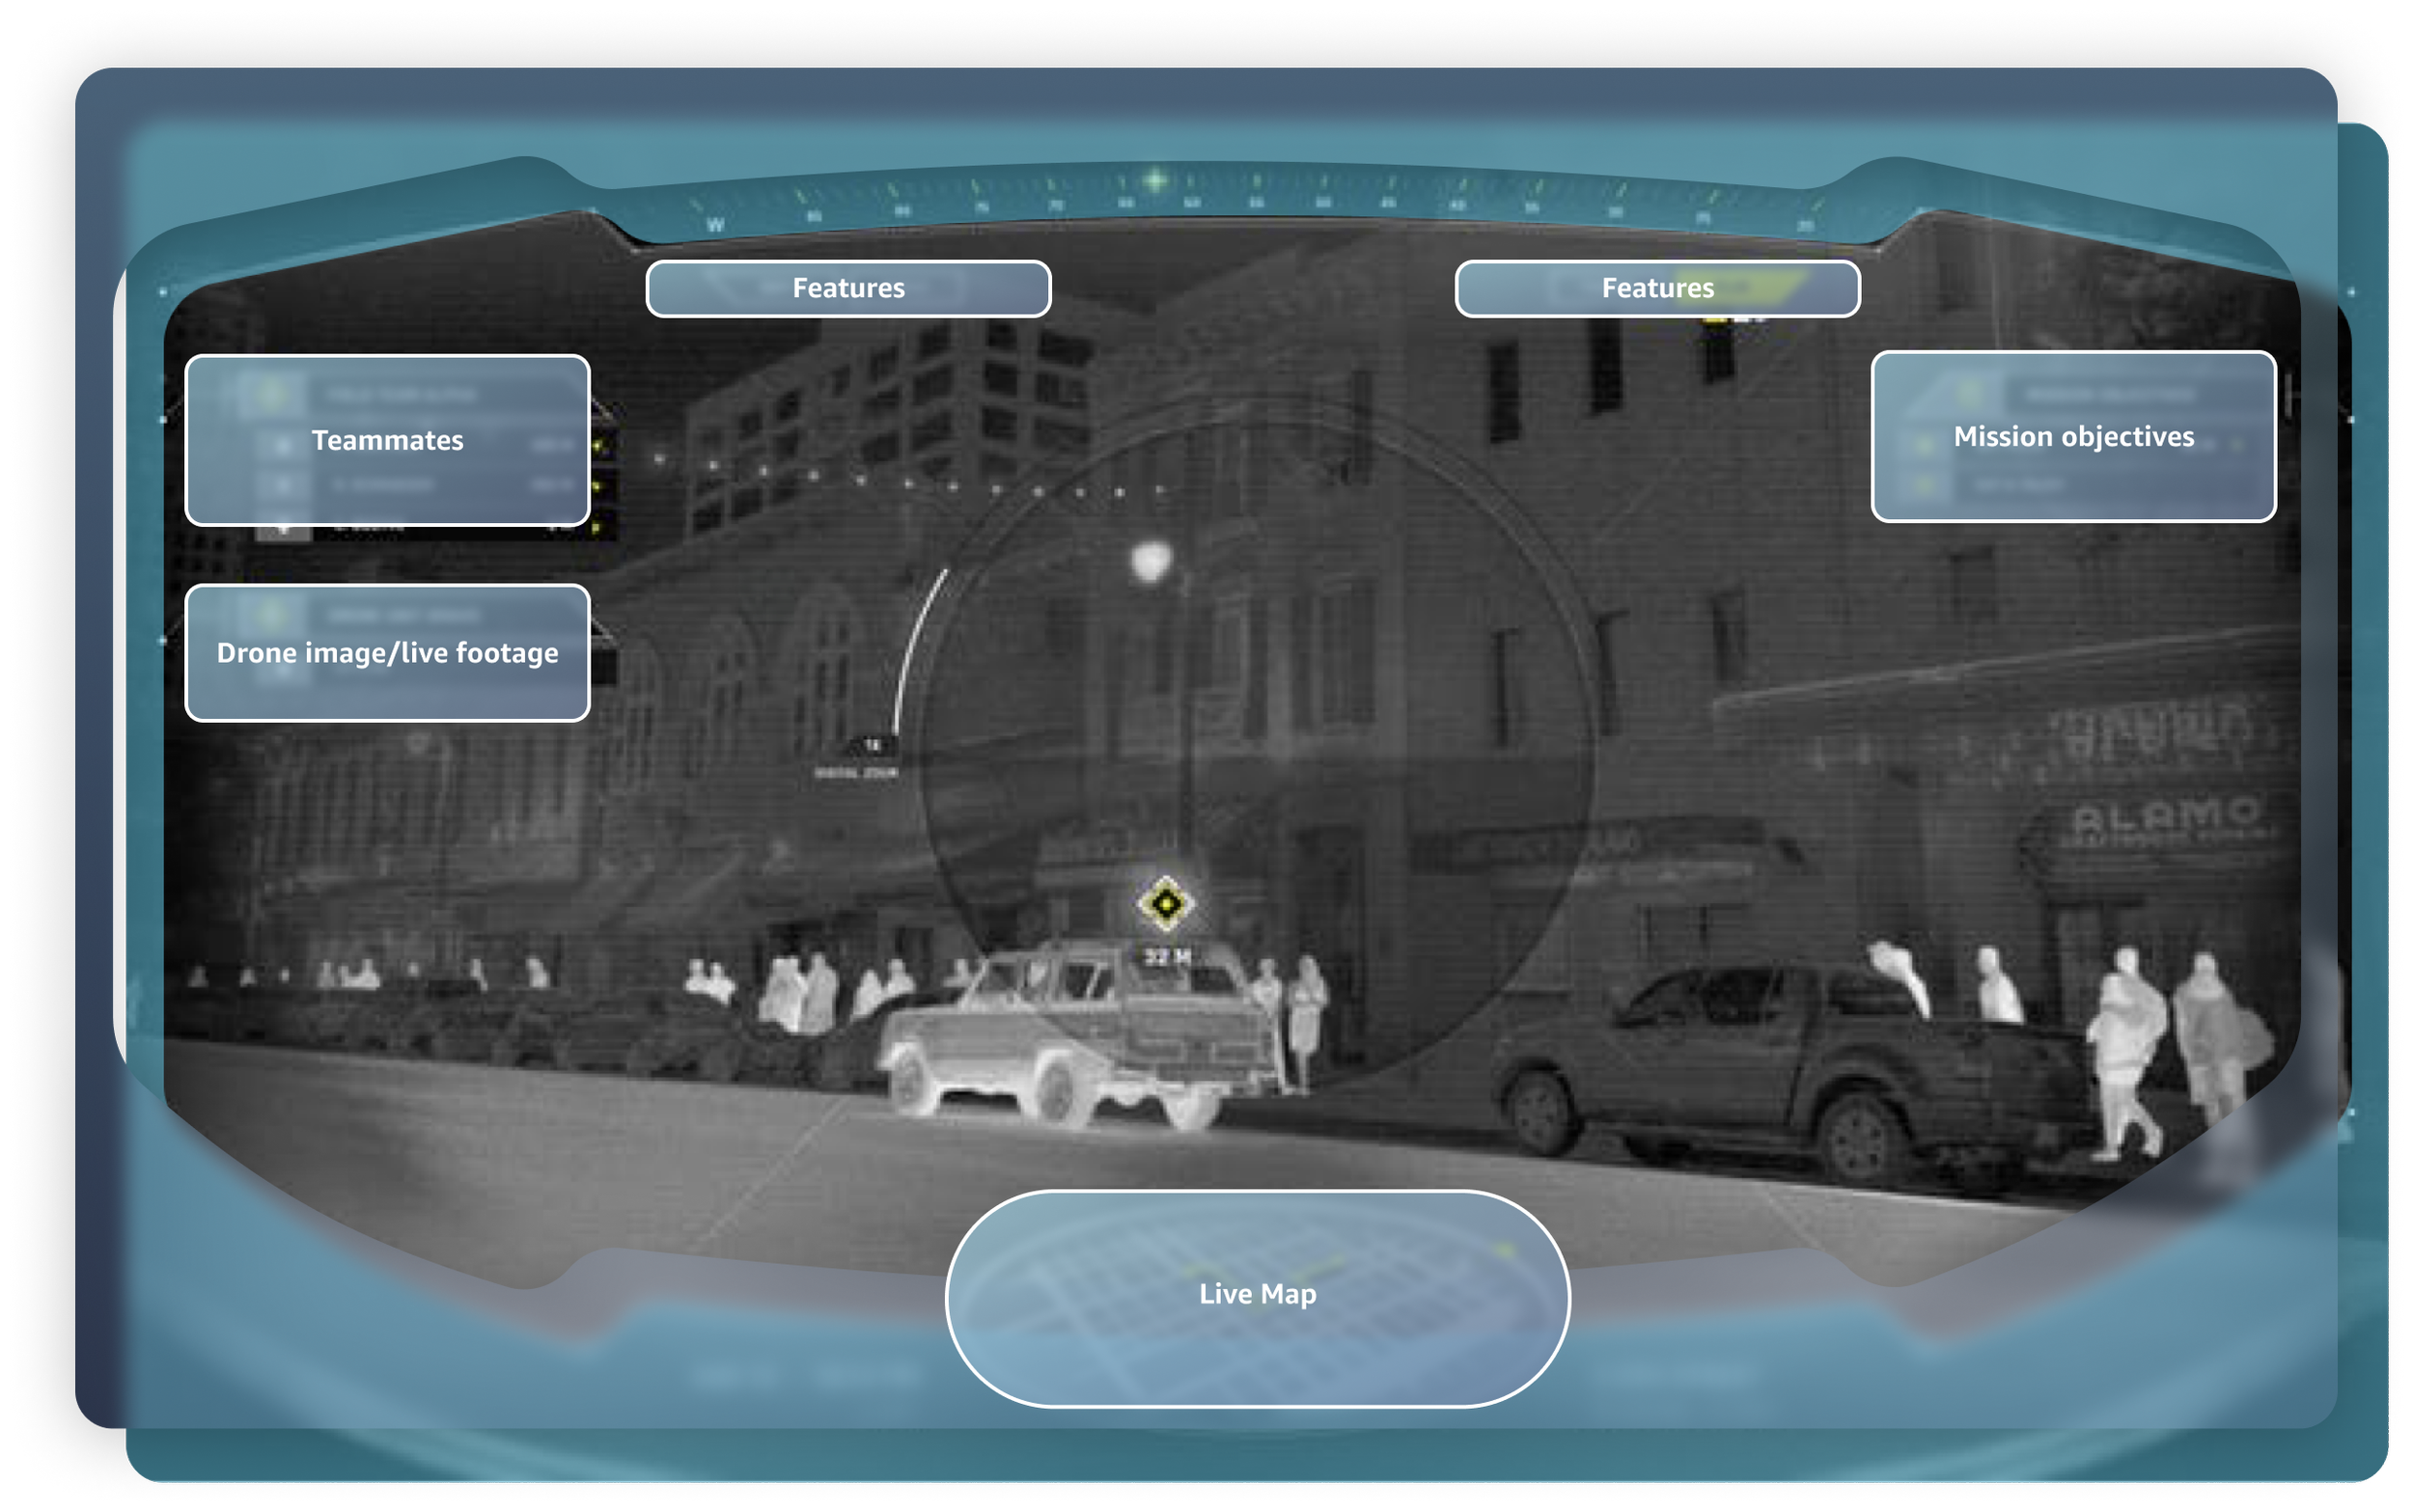
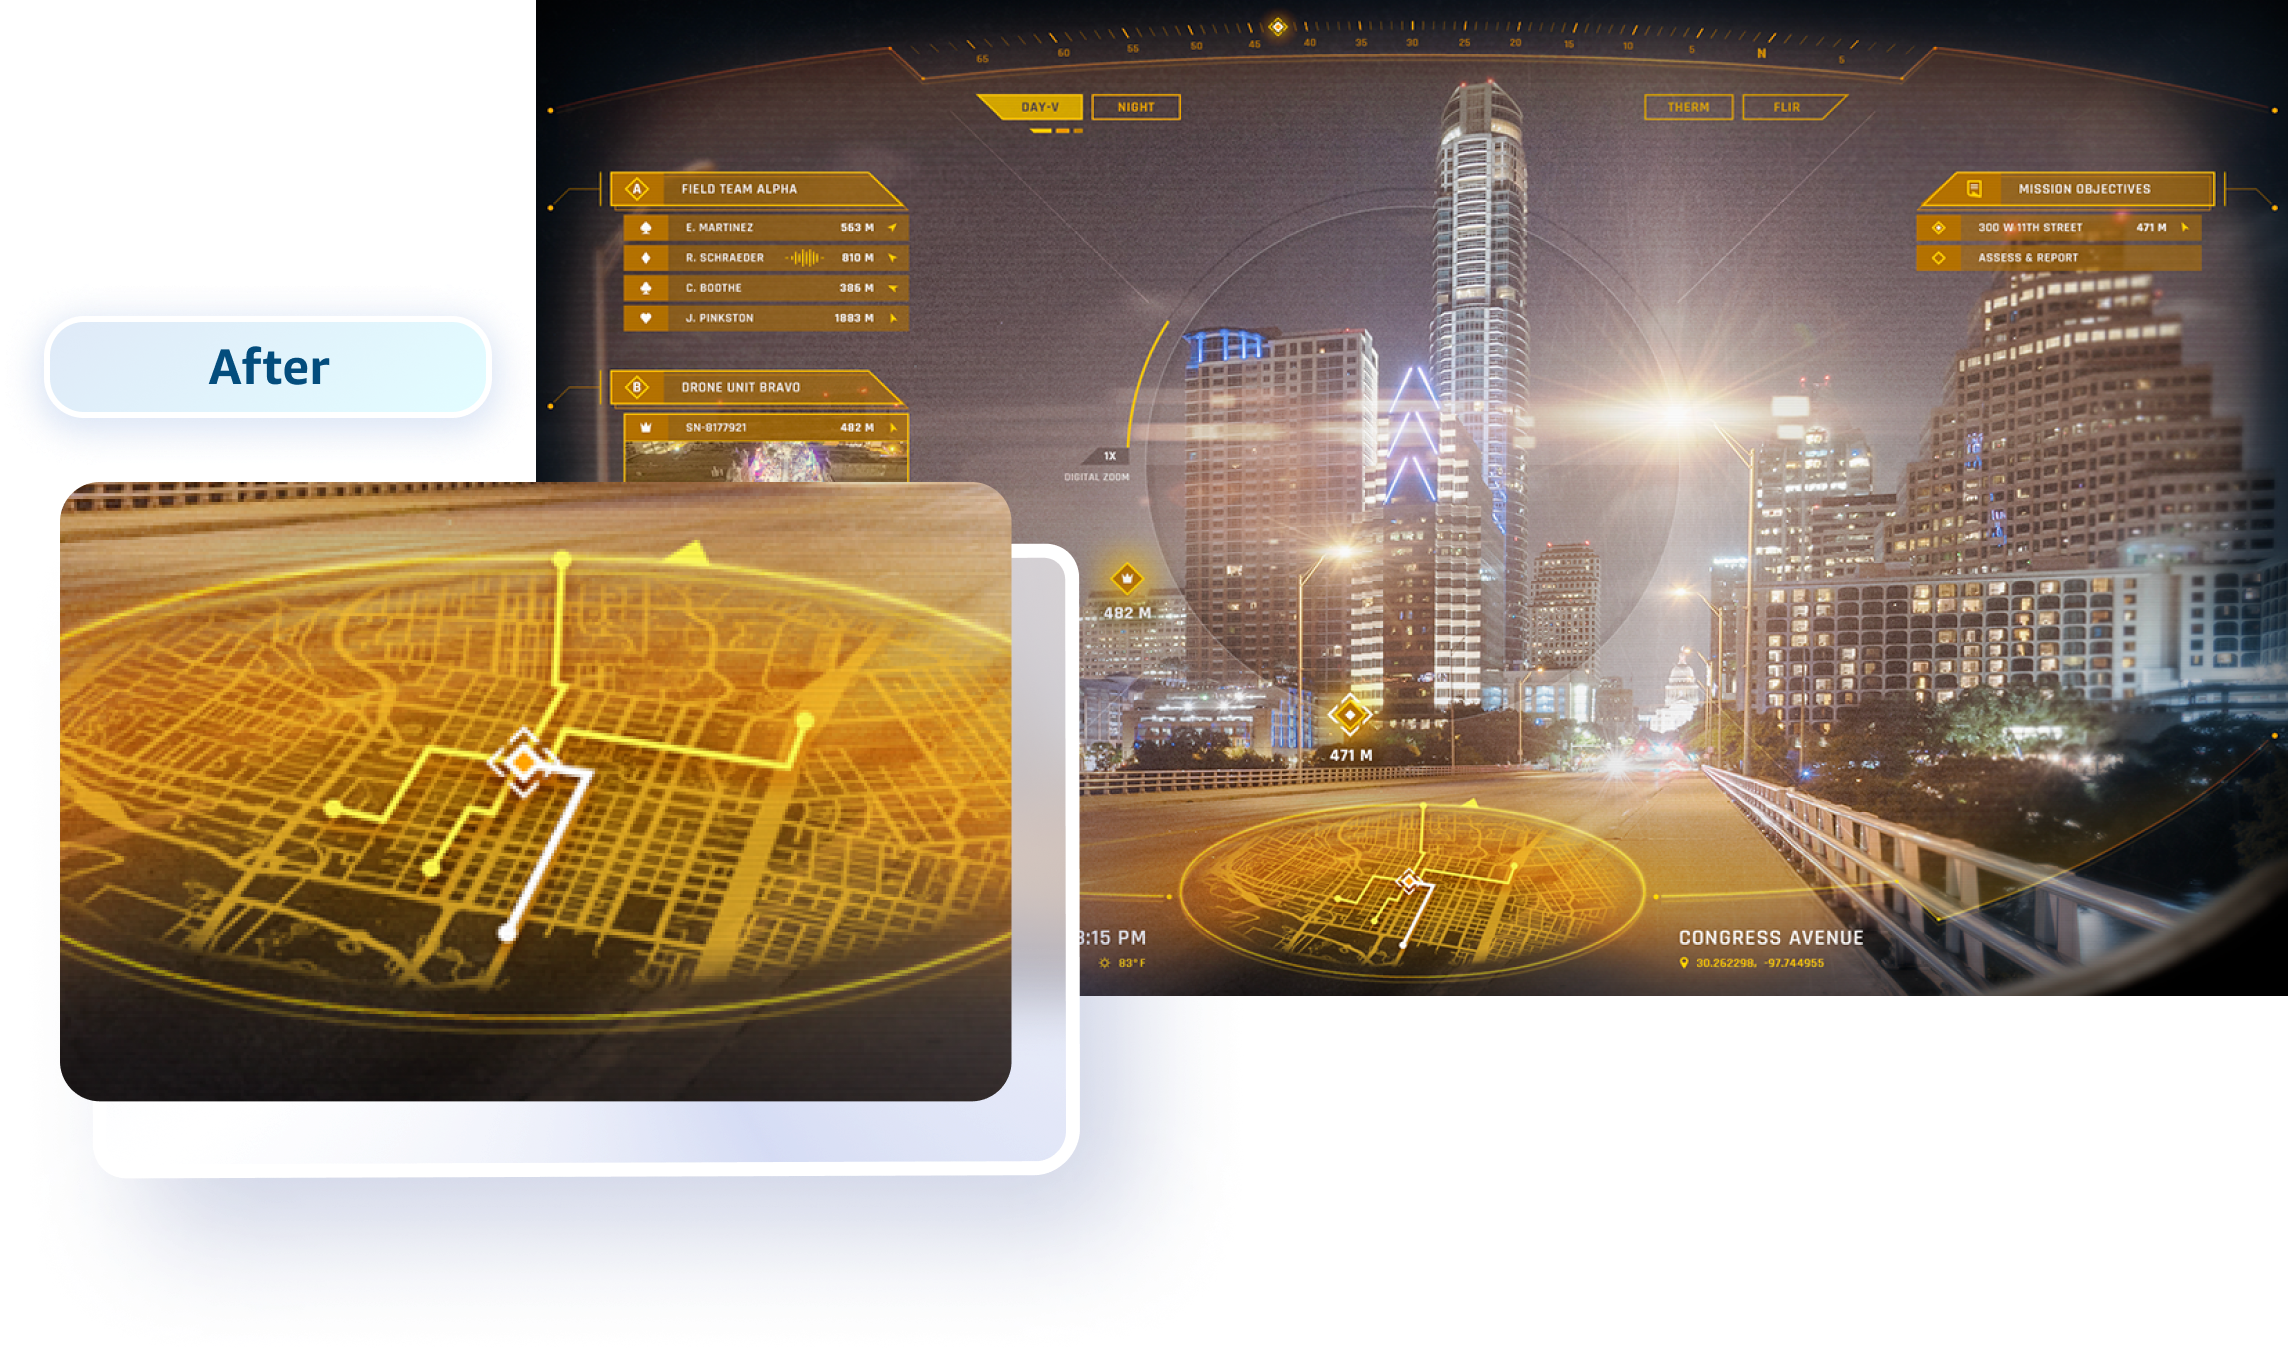
The Final UI stayed simple to ensure readability and usability for users even during movement. The essential environmental and navigation data is also segmented into smaller units for improved readability and to counter distortions. A curved compass is implemented on the top as a visual guide and indicator to display users’ real-time directional movements.
Challenge 3
Motion Sickness: During the user testing phase, 20% of participants reported experiencing dizziness and nausea due to visual instability and excessive animations in the prototype. Based on these findings, I minimized the use of animations and simplified the 3D map to a 2D version to improve readability and decrease cognitive load.


Key Features
Target Audience
Firefighters: Use building scans or blueprints with 3D camera data to guide firefighters in dark fire scenes. Enhance visibility in low-light fire scenes by overlaying a polygonal map onto key elements such as walls, staircases, and doors.
Undersea: Undersea cable, welding, or salvage that could benefit from water current temperatures, seafloor depth, etc.
Search and rescue: that could benefit from avalanche forecasts, mapping, forest alerts, heat signatures, and more.
Investigative situations: where the helmet allows the wearer to see heat signatures and other potentially visual things that might be enabled by sensor arrays that might be used in the hand in conjunction with the active display.
External Data Sources
GPS data
Mission briefing
Technical information from other teams/location of team members
Ability to view and access another helms information
Task updates that come from command operations
Display point cloud mesh for known areas.
Features
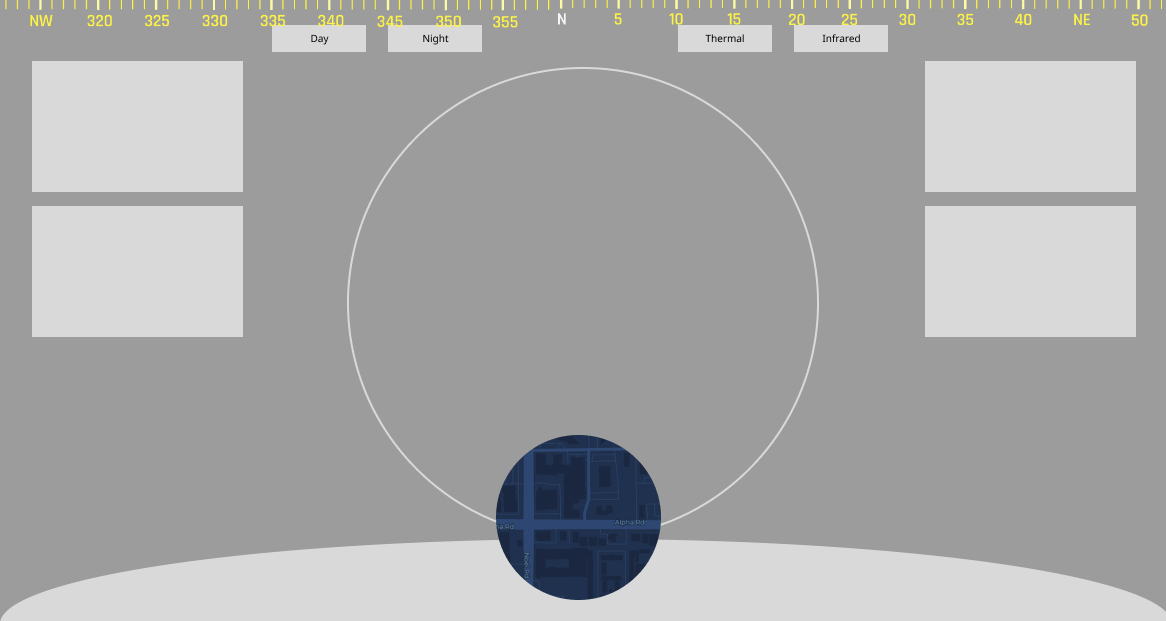
5k resolution with a 200-degree field of vision (FOV)
High-resolution binocular optical input
Multiple spectrum sensor arrays including infrared, etc
AR-style informational overlay
Multiple display modes
Hand tracking and gesture-based input
Automated data aggregation from mounted sensors

After analyzing data from user research and surveys, we identified our target audience as professionals working in hazardous environments like firefighters and search and rescue teams. We tailored the features and designs of the Orion Helmet specifically to address the daily challenges and needs of this target audience. The Helmet design was selected to provide an additional layer of protection and potentially serve as an oxygen mask, allowing users to navigate terrains with limited oxygen availability.
Final Design
Modes of Display
In the final product, we kept four viewing modes that covered the broadest range of visual obstacles, which included Day Vision, Night Vision, Thermal, and Infrared. These four display modes encompassed all critical scenarios identified during user testing and research, including low-light settings, visually impaired conditions, adverse weather conditions, and navigating unfamiliar terrains.


Night Vision

Thermal Vision

Infrared Vision
Reflections
Overall I really enjoyed working on this project and acting as a point of contact between multiple teams as the lead UIUX Designer. I firmly believe in taking ownership of my and exerting every effort to ensure the project's success, especially if it means taking on responsibilities that extend beyond my designated role.
I would like to incorporate additional accessibility options, such as different color settings for color blindness and the potential inclusion of gesture and voice control features within the UI.


